Mobility Matters Extra - Do people still want to drive?
As always, even a quick look at the data shows something more interesting going on
Key points:
There has been a drop in the number of driving licences owned by people aged 30 years old and under;
The most significant drop in the number of driving licences owned has been by those aged 40 to 49 years old;
There has been significant growth in driving licence ownership by those aged 70 years old or over;
There appears to be no significant difference in changes between urban and rural postcode districts, but this analysis is inconclusive.
You will have seen the headlines over the years. Young people just aren’t driving anymore. They are more interested in the latest smartphone than they are in the latest car.1 Such assumptions have always sat poorly with me. Partly because this is picking and choosing datasets, and so making connections where they may not exist. But also, because I have always wondered about both the intent, and variation between people and areas that makes policy making more interesting.
Luckily for us in the UK, we have a dataset that allows us to get some insight into this. Data on both driving tests taken, and driving licence statistics are very useful in terms of showing intent to drive, and shows how that varies according to area. So lets do a bit of analysis on this data.
I did a couple quick bits of analysis. Firstly, how the total number of licences held by different age groups (15-21 years old2, 21-30 years old, 31-39 years old, 40-49 years old, 50-59 years old, 60-69 years old, and 70 years old and over) has changed since 2015, and secondly how this has varied by postcode area/
Over time, the total number of licences across all age groups has increased. As of 2021, there are around 41 million driving licence holders in the UK, compared to 38 million in 2015. For people aged 15 to 21 years old, the total number of licence holders fell by just over 200,000, with a 59,700 fall in total licence holders in people aged 21 to 30 years old over the same time period. Meanwhile, the number of licence holders aged over 70 years old increased by 1.2 million, and the total number of licence holders aged 40 to 49 years old decreased by 428,000.

In case you missed that, the total number of licences held by those aged 40 to 49 years old dropped by more than everyone aged under 30 years old. When we look at the percentage breakdown, that same trick is repeated. The change in percentage of those aged 40 to 49 years is greater than that of those aged under 30 years old.
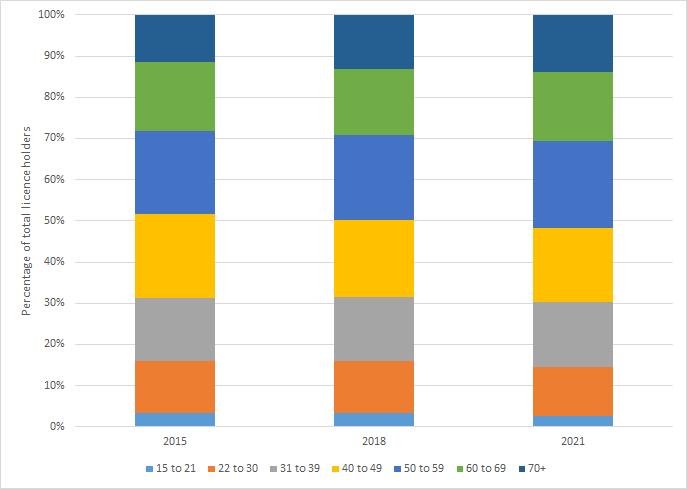

I personally do not have an explanation for this significant change in those aged 40 to 49 years old. The growth in all age groups over 50 years old can partly be explained by the progressive ageing of the population. But for those middle aged, I cannot explain, or even attempt to explain without more analysis.
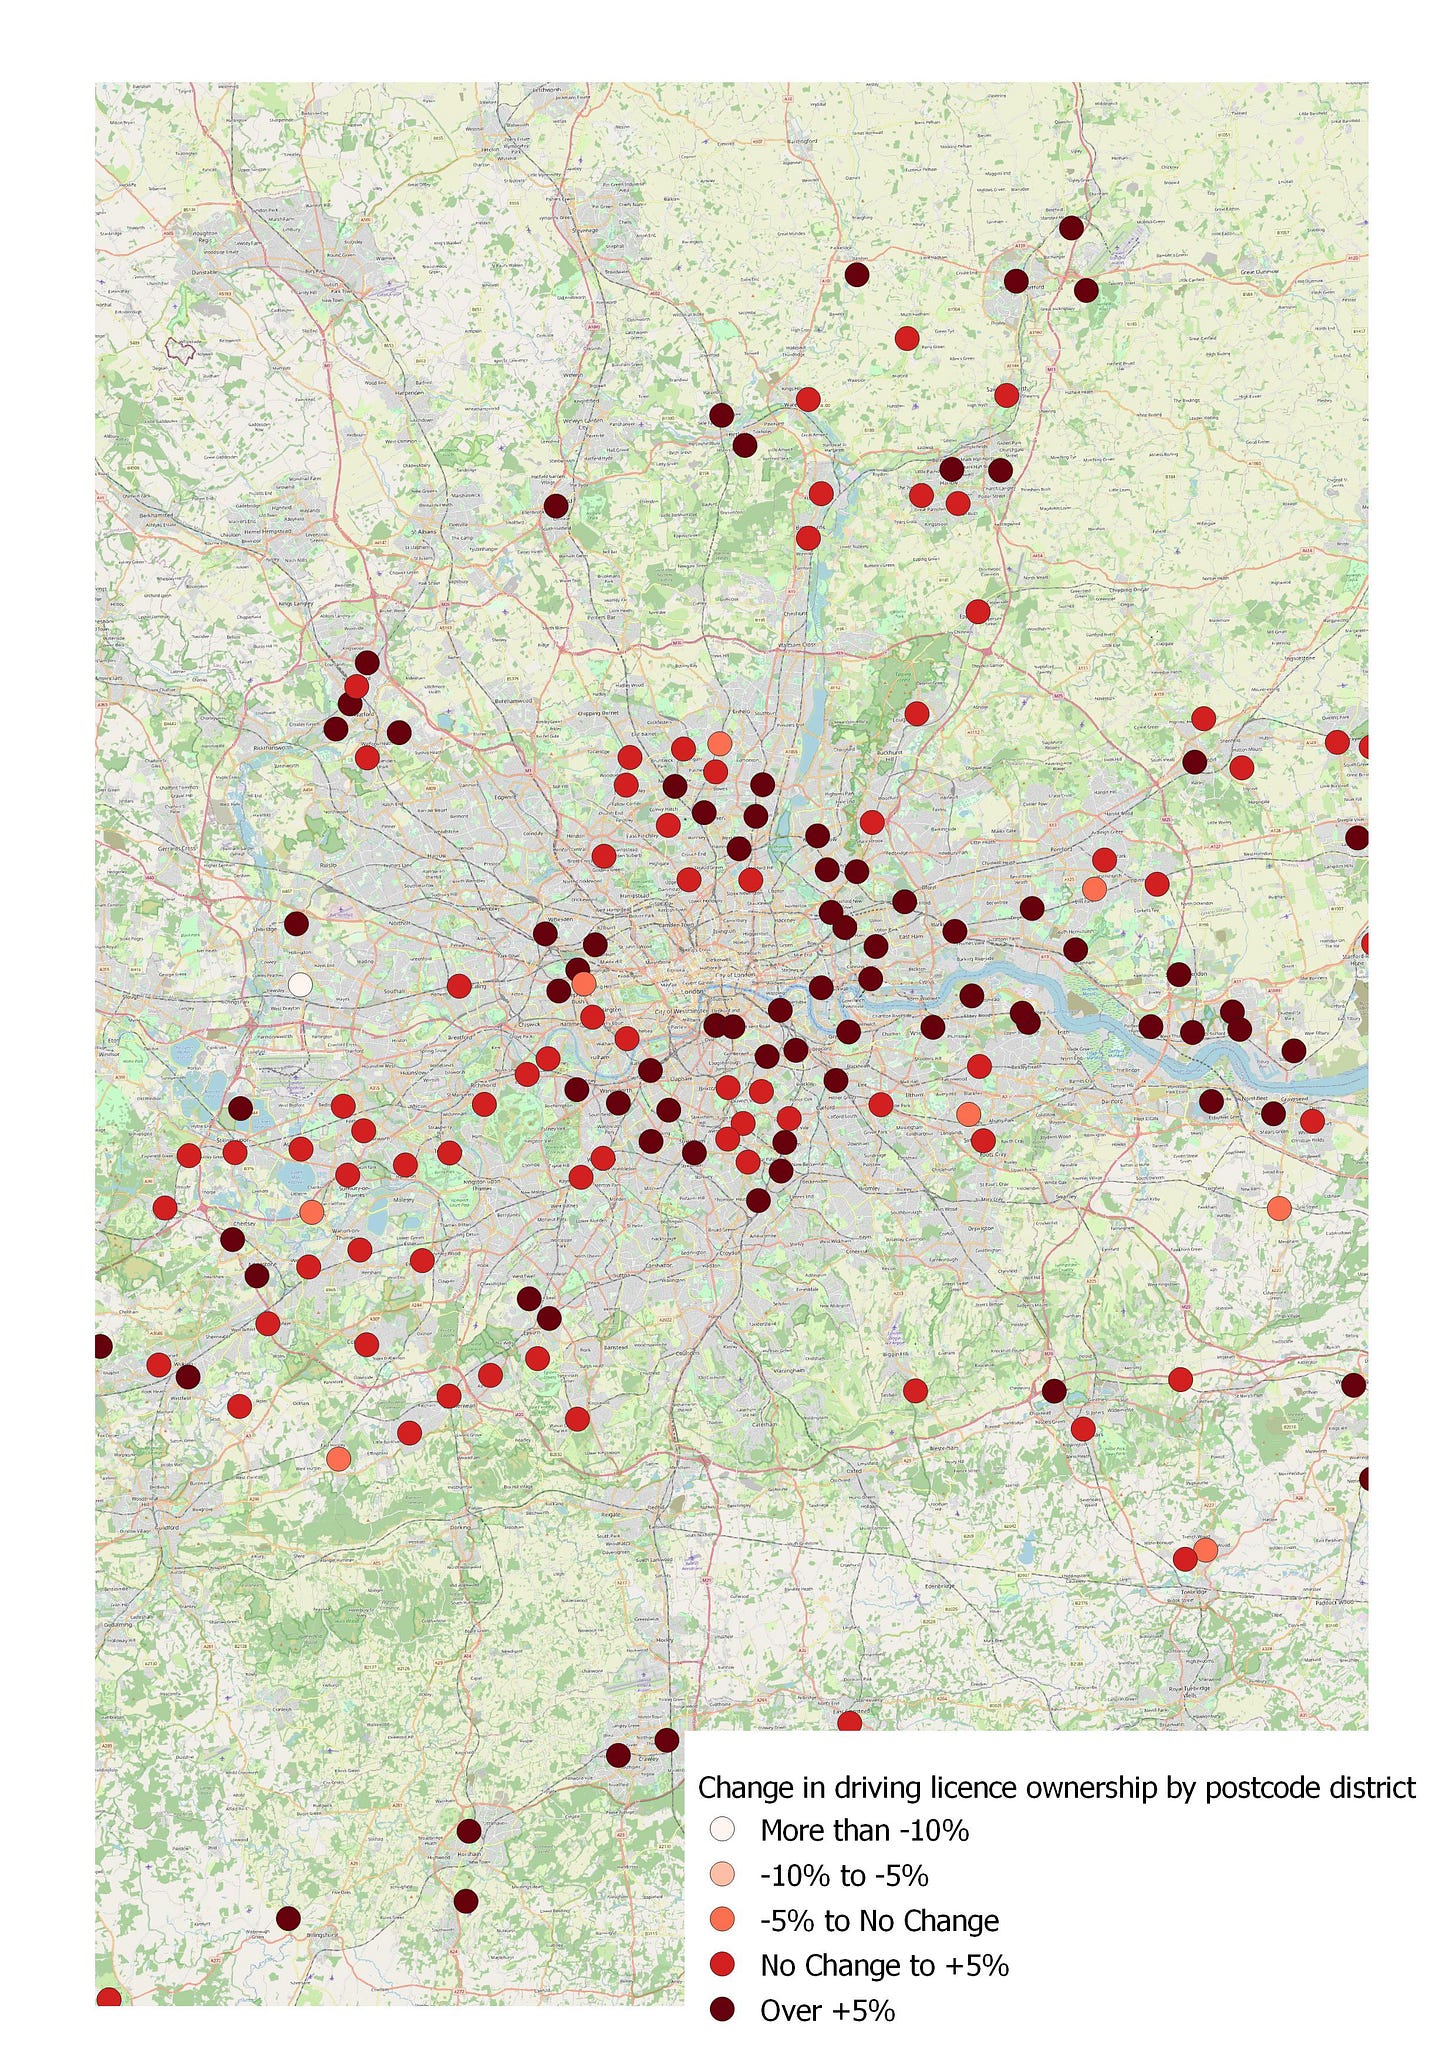
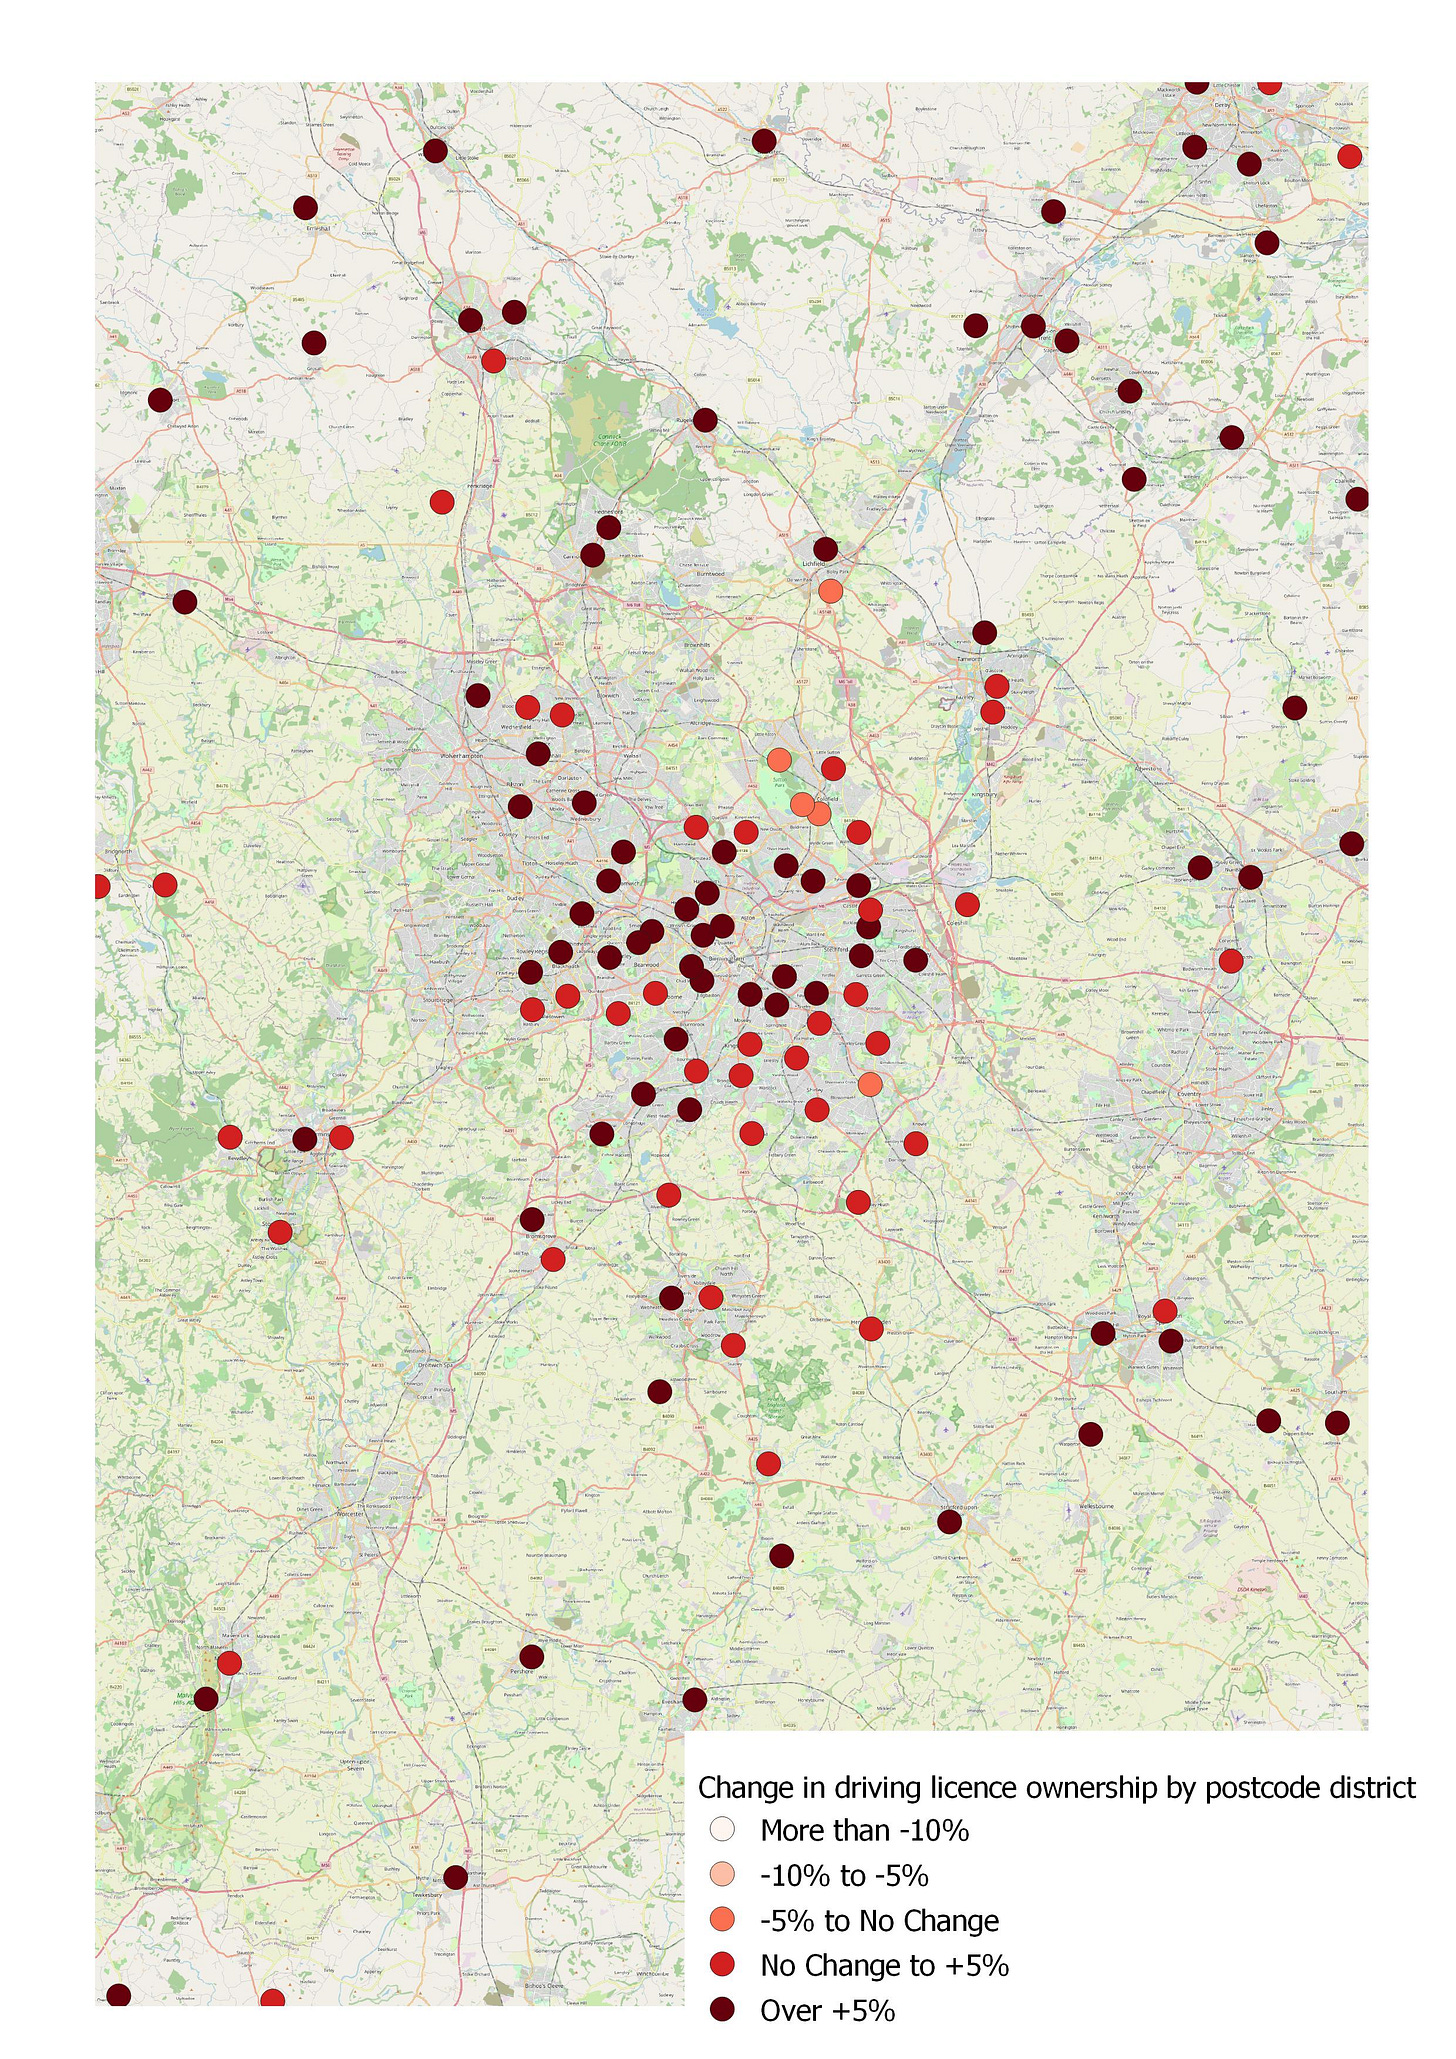
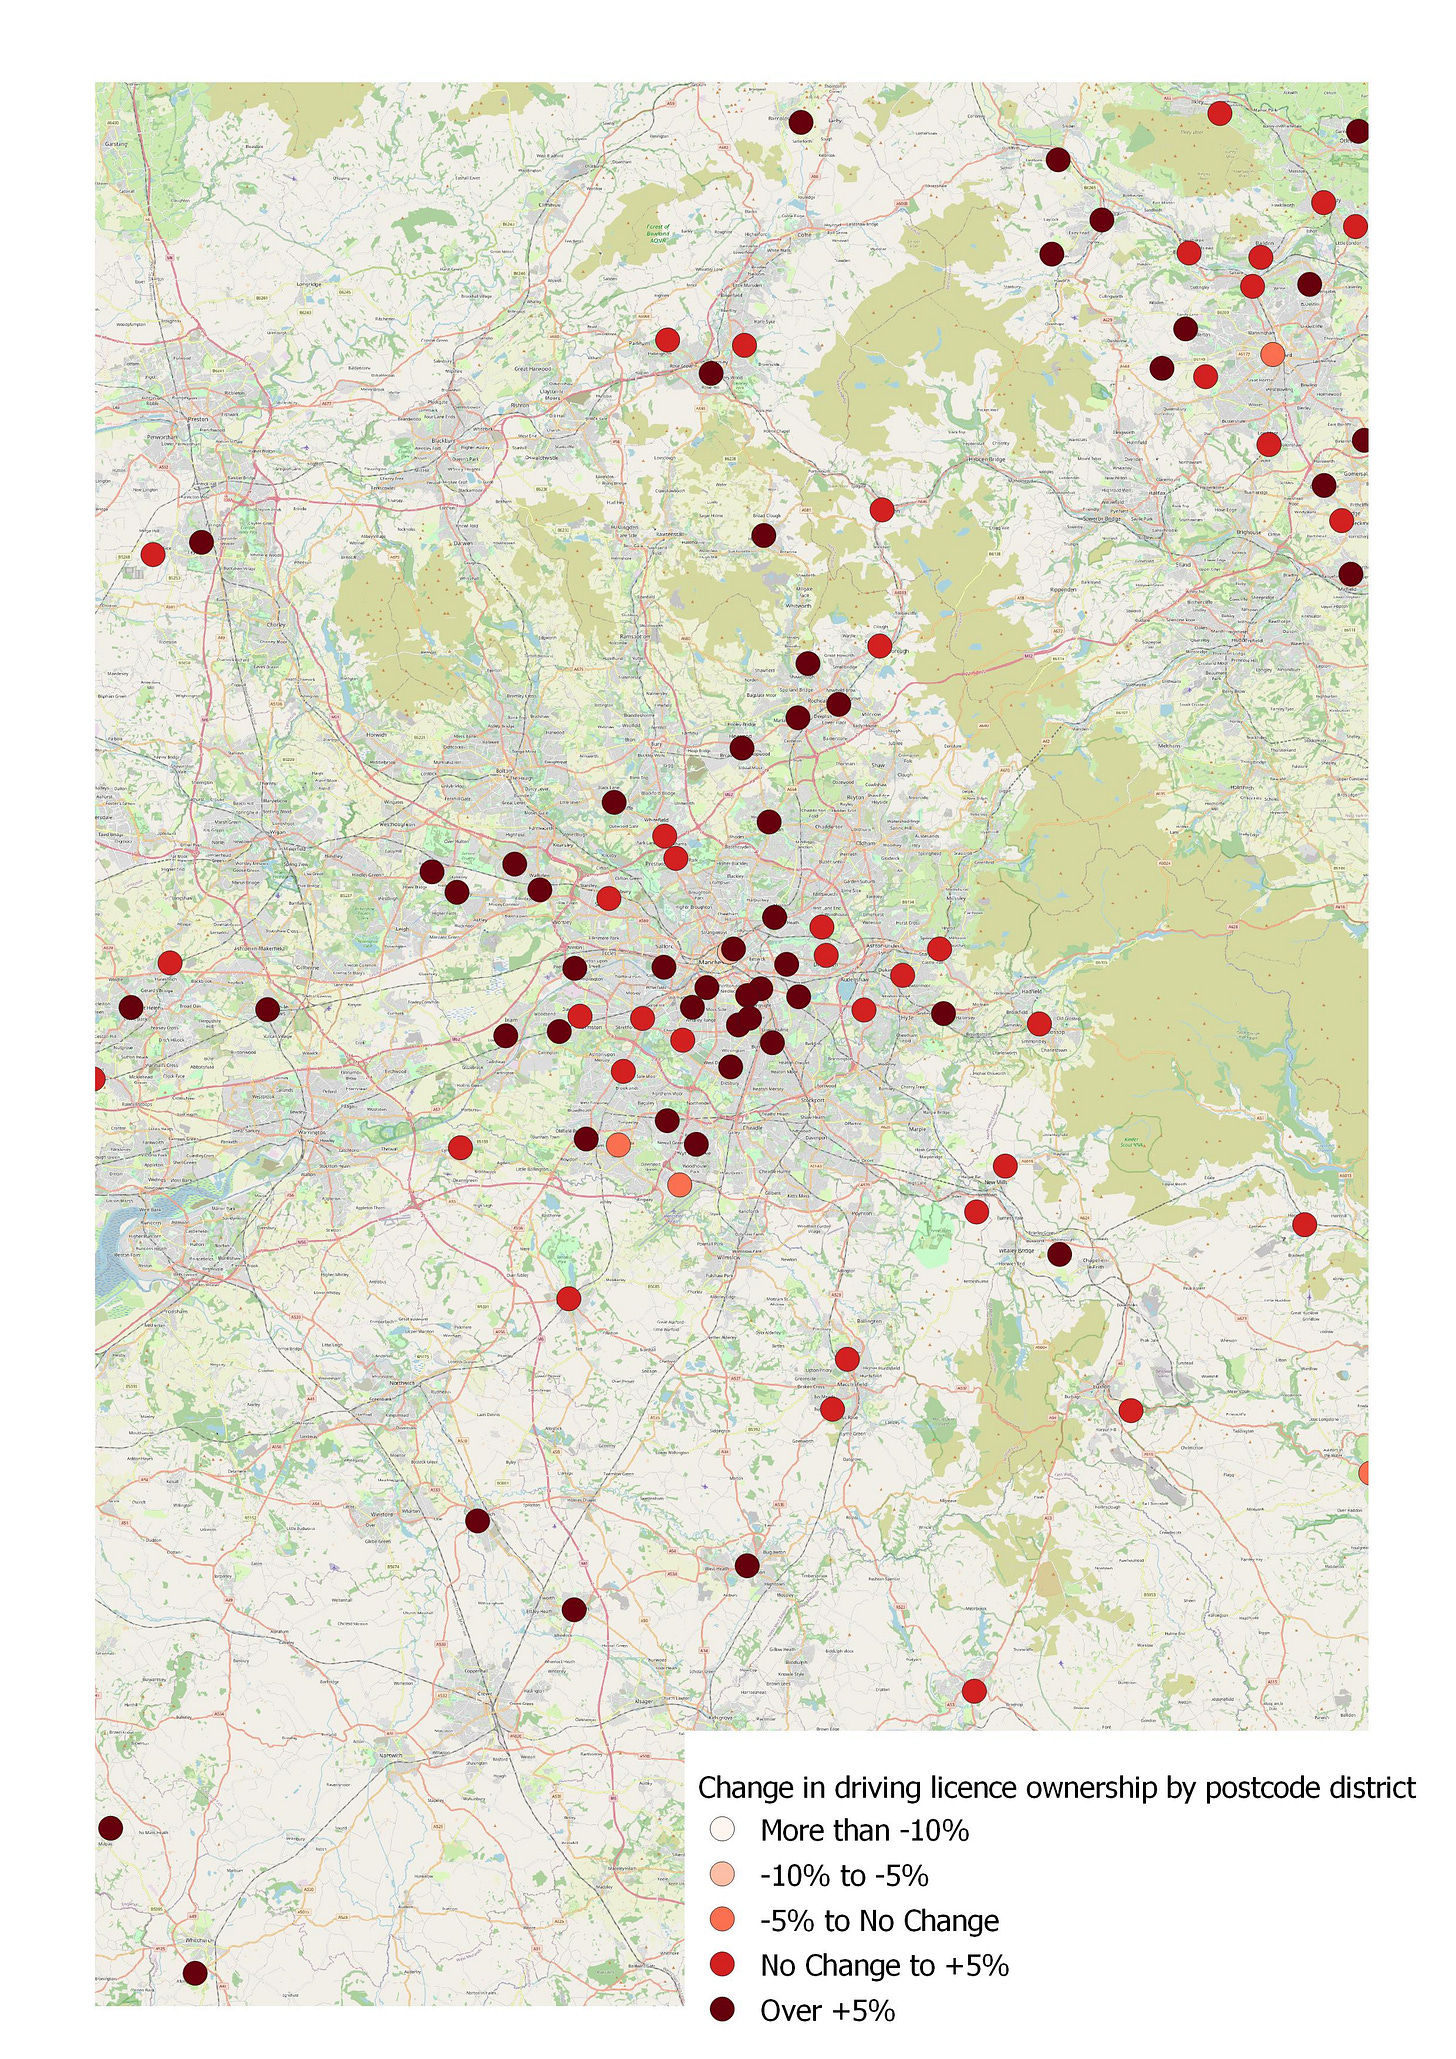
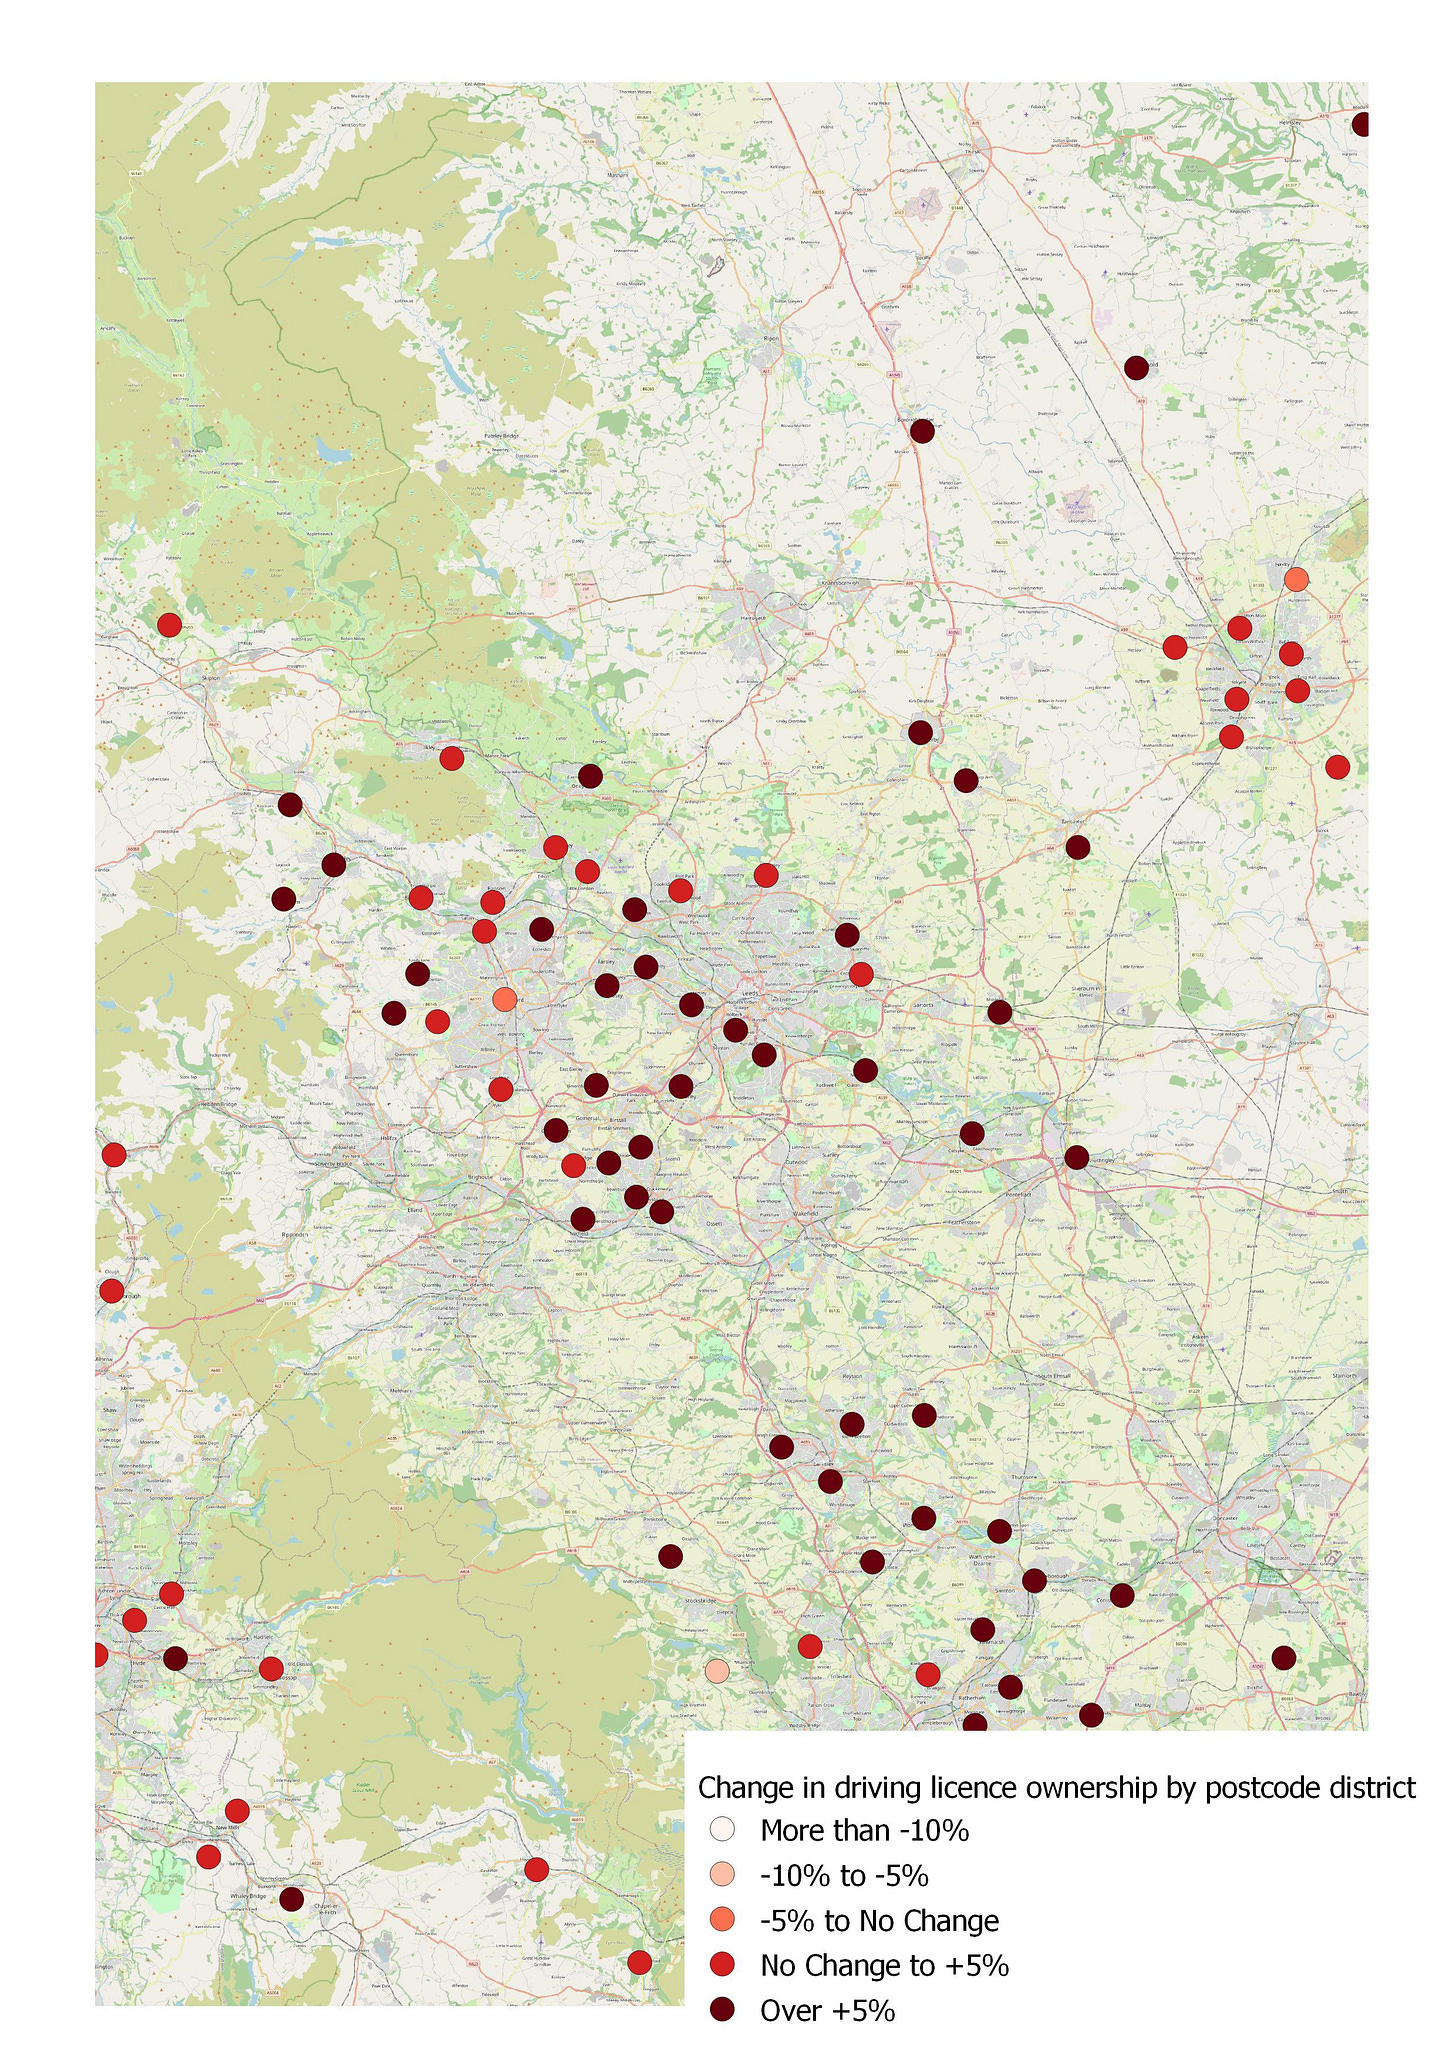
I also did a further quick analysis to understand the percentage change at a local level by postcode district. The results of this quick analysis are shown here.
These maps appear inconclusive. Whilst it seems the majority of postcode districts are showing an increase in total driving licence vehicle ownership, with no clear difference between rural and urban areas. Whilst the picture in London seems more mixed, that may be due to the fact that there are more postcode districts that give a more mixed visual.
I will be doing more data analysis this week. But from just this short post, you can see that there is more to the mystery of people putting off car ownership than meets the eye.
Based on the often strange assumption that young people buy new cars, as opposed to getting some clapped out old banger from the second hand market.
In the UK, you can own a provisional licence from the age of 15 years old.


