

Good day my good friend.
You know what, this week has been a good week. So I am feeling in somewhat of a chipper mood. Its just as well because this weekend it will be glorious sunshine and, in the words of the British, bl**dy hot. At least in the part of the country where I am.
I also haven’t mentioned Mobility Camp in a while. Our early sign ups have been great, and if it keeps going we will have the biggest Mobility Camp ever. Its in Sheffield on 30th September. So, you should sign up.
🚖 Why you cannot trust national statistics on taxis and private hire vehicles
If you tried to guess where the country’s busiest private hire licensing authority was, you would probably point at London. A reasonable second guess might be Manchester, or Birmingham, or another big city that is part of national conversations on regeneration and increasing productivity. You almost certainly would not point at a West Midlands city of 268,000 people that most national commuters would struggle to place on a map.
And yet, according to the Department for Transport’s latest taxi and private hire vehicle statistics, the City of Wolverhampton Council is responsible for one in every nine Private Hire Vehicles (PHVs) registered in England and Wales. It licenses more PHV drivers than the population of small market towns. Its driver register has grown by a factor of forty in just over a decade. And the vast majority of the people on that register have probably never set foot in the city itself.
It is partly a story about a clever bit of legislation, partly a story about app-based dispatch, and partly a story about a council that spotted an opportunity and ran with it. But more than any of those things, it is a story about a quiet methodological problem for anyone trying to understand the taxi and private hire trade in their own patch. Wolverhampton’s numbers do not just dominate the league tables. They distort the entire picture of who is operating where, and that should bother anyone responsible for transport policy in a place that has nothing obvious to do with Wolverhampton.
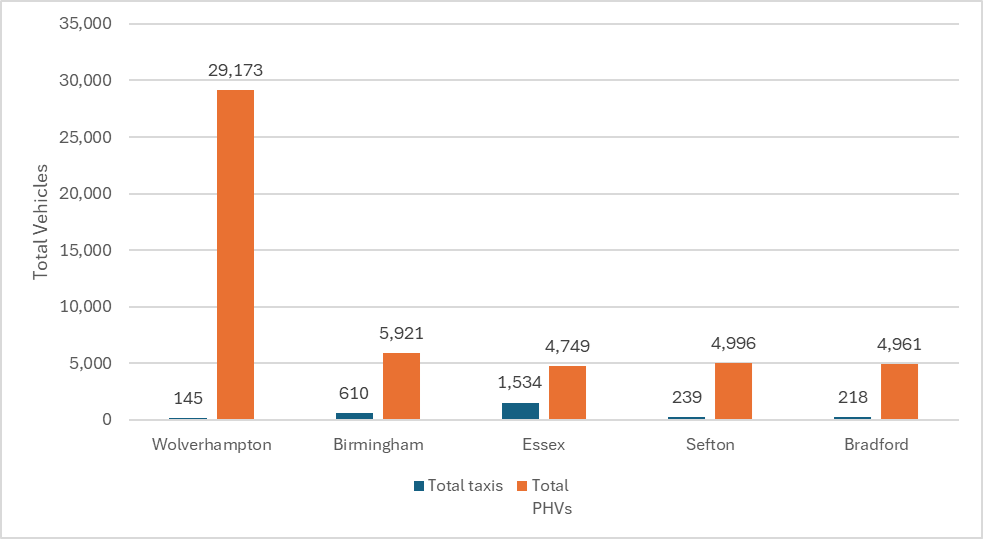
Let us start with the headline number. In 2024 Wolverhampton licensed 29,173 private hire vehicles and 145 taxis. That is 29,318 licensed vehicles in total, sitting behind a council that serves a population of 267,651 according to the latest mid-year estimate. By the simple arithmetic of dividing one by the other, Wolverhampton has 109 PHVs licensed per 1,000 residents.
To call that an outlier is to undersell the case. Across the 316 individual licensing authorities in England and Wales, the median figure for PHVs per 1,000 people is 1.64. The mean is 2.74. The 95th percentile is just over 7. Even the 99th percentile, the threshold above which an authority counts as one of the three or four most concentrated in the country, sits at 13.7 PHVs per 1,000 residents. Wolverhampton’s figure is roughly eight times that 99th percentile, and around 66 times the national median. It is not at the top of the distribution. It is on a different distribution.
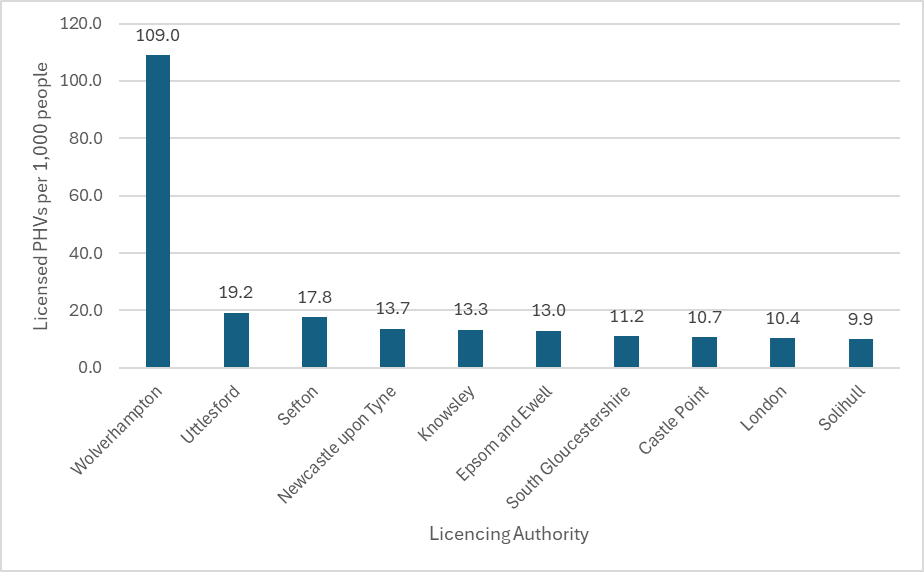
The next-closest authority on the league table is Uttlesford in Essex, at 19.2 PHVs per 1,000 people. Sefton on Merseyside comes in at 17.8. London’s combined Transport for London licensing area, which covers nearly nine million residents, manages 10.4 PHVs per 1,000. Wolverhampton is therefore around five-and-a-half times more PHV-dense than the next ranked council, and more than ten times the per-capita density of London itself.
Even within the West Midlands the picture is bizarre. Solihull, just down the road, has around 10 PHVs per 1,000 people. Birmingham, with a population more than four times Wolverhampton’s, has 5,921 PHVs licensed, against Wolverhampton’s 29,173. So a city that is roughly a quarter the size of Birmingham licenses around five times as many private hire vehicles. The numbers stop making physical sense if you assume the vehicles are actually being driven in Wolverhampton.
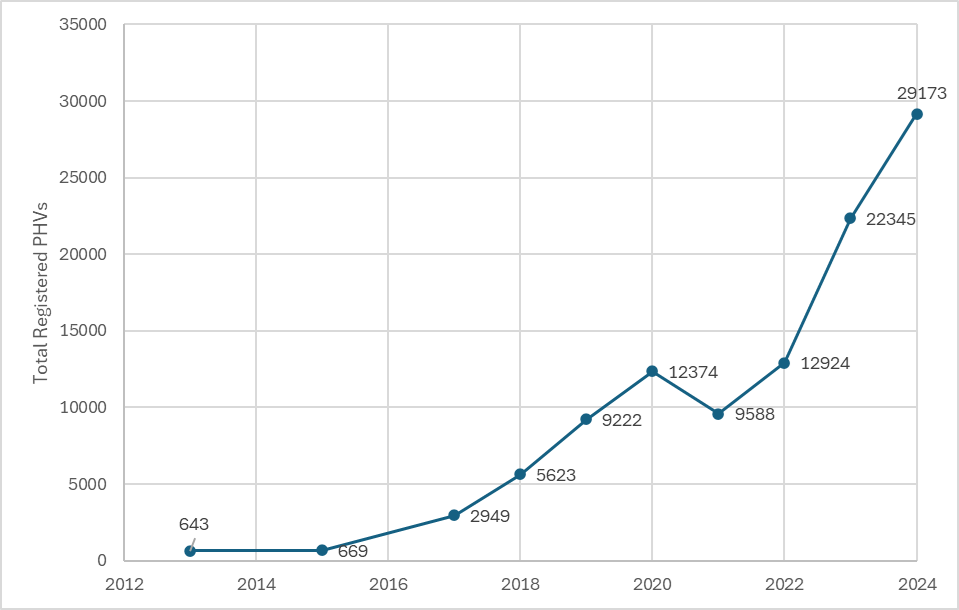
The historical viewmakes the divergence even sharper. In 2013, Wolverhampton licensed 643 PHVs. In 2015, it licensed 669. By 2019 the number had jumped to 9,222. By 2023 it was 22,345. By 2024 it had reached 29,173. That is a 45-fold increase in eleven years, set against a national PHV stock that has grown by perhaps a third over the same period. Wolverhampton’s driver register has followed a similar curve, climbing from 1,047 in 2013 to 42,843 in 2024, of which 42,622 hold PHV-only licences. Industry reporting suggests that by 2025 the council had pushed its PHV licence count toward 35,000, with driver numbers approaching 45,000.
This matters for transport planning, and it matters for very specific reasons. The first is that the DfT itself acknowledges the issue in the small print of its statistical release. The national and regional figures are labelled accredited official statistics, but the figures for individual licensing authorities sit outside that scope. They are, in DfT’s own phrasing, less robust. Translated into plain English, the department is warning users that you can trust the totals, but you should be careful about taking any one council’s numbers at face value.
The second reason it matters is more practical. If you are a planner in Manchester, or Bristol, or rural Cornwall, and you go to the official statistics to understand the taxi and PHV supply in your area, you will find a number. That number will reflect the vehicles licensed by your own council. It will not reflect the very large number of vehicles licensed elsewhere that are actually operating on your streets. The data will tell you, for example, that there are around 2,900 PHVs licensed in Manchester. It will not tell you that several thousand more, including many Wolverhampton-licensed vehicles, are routinely picking up passengers there. The map and the territory have come apart.
The third reason is that taxis and private hire vehicles are often treated as a peripheral topic in transport planning. They tend to get a chapter at the back of a Local Transport Plan, or a section in a town centre access study, and not much more than that. They do not get the attention that bus, rail, walking or cycling receive. When the data underpinning that secondary attention turns out to be unreliable, the problem compounds. We are not paying close attention to the trade in the first place, and the headline numbers we do glance at are systematically distorting how we think about it.
The mechanism behind the Wolverhampton effect is not complicated, but it does require holding two separate ideas in your head at once. The first is the Deregulation Act 2015, and specifically the changes it made to the way private hire bookings can be subcontracted. Before 2015, an operator licensed in one district could not pass a booking to another operator outside that district. After 2015 it could, provided the booking was passed to an operator licensed elsewhere who in turn used a driver and vehicle licensed in the same district as that second operator. This is sometimes called the triple lock, because the operator, the driver and the vehicle must all be licensed by the same authority for the chain to be legal.
The legal architecture remains intact. What changed is the use to which it was put. Once the subcontracting principle was settled, a national app-based platform could in principle obtain a single set of operator, driver and vehicle licences from a single sympathetic authority and dispatch work nationwide. Consequently, the Local Government Association has formally called for a Taxi and Private Hire Vehicle Licensing Reform Bill to replace the existing legislation.
Wolverhampton’s role in all of this is partly accidental and partly deliberate. According to written evidence to the parliamentary inquiry, councils in Greater Manchester argued in late 2025 that Wolverhampton’s specific operating choices have helped accelerate the trend. The example most often cited is vehicle testing. Most licensing authorities require licensed vehicles to be tested within their own area, often at council-run or council-approved garages. Wolverhampton, by contrast, accepts an MOT certificate from any MOT station in the country, which makes it practical for a vehicle being driven in Berwick-upon-Tweed to hold a Wolverhampton licence. The application process is generally regarded as fast and predictable, and the fees are competitive. The council itself has publicly defended its work and pointed to safeguarding measures such as daily DBS monitoring and mandatory training. Whatever view you take of those individual choices, the cumulative effect has been to make Wolverhampton an attractive home for drivers and operators with no real connection to the city.
A Freedom of Information disclosure cited by Salford City Council found that around 9,000 Wolverhampton-licensed drivers are resident in the Greater Manchester area alone. Industry data published by Zego suggested that in the year to March 2024 the council issued 32,169 PHV licences, of which only a few hundred went to drivers actually living in Wolverhampton. There is now a regular pattern of cross-border enforcement operations in which Wolverhampton compliance officers travel out to places like Cheltenham, Chorley, Macclesfield and Cheshire to check on the vehicles bearing their plates. Those operations are praised by some and criticised by others, but they reveal something important. The trade Wolverhampton regulates is, in physical reality, taking place hundreds of miles away.
For planners, the analytical problem here is more subtle than the headline numbers suggest. It is not simply that Wolverhampton’s count is too high relative to its size. It is that the very category of locally licensed vehicle has become an unreliable proxy for locally operating vehicle. Once a national operator can plug into any authority’s licensing regime, the geographic information embedded in the licence ceases to map cleanly onto where work is being done. The same is increasingly true at the other end of the league table. Many authorities now have very few locally licensed PHVs, not because there are no PHVs operating in their area, but because their local drivers have gravitated to Wolverhampton or to one of a small number of other permissive authorities. Their headline figures understate the trade just as Wolverhampton’s overstate it.
There is also a user-facing dimension. Researchers at the University of Leeds looked at the impact of the Deregulation Act on taxi-related incidents and crime events in the city. They found a marked increase in new private hire driver licence applications in Leeds after the Act came in, much of it tied to the rise of app-based dispatch. They also identified shifts in the pattern of taxi-related calls for service. If you want to study how the trade actually behaves in Leeds (or any other local area), you cannot just go to the council’s licence register. You need to build a more careful picture from operational data, on-the-ground observation and police records. The Wolverhampton effect makes that necessity universal.
It also distorts comparative work. Place-based research that ranks authorities on, say, the proportion of wheelchair-accessible vehicles, or the share of PHVs with low-emission engines, will tell you something interesting about Wolverhampton’s specific policy choices. It will tell you very little about the actual mix of vehicles on the road in any given city, because the licensing categories no longer map onto the operating categories. Local councils end up regulating a tiny share of the vehicles serving their residents, while a different council somewhere else regulates a very large share of the vehicles serving residents it never sees.
The first move, and the most practical one for anyone in transport planning right now, is to stop relying on the licensing data as a single source of truth about local taxi and PHV supply. The DfT’s own caveat is doing a lot of work in that respect, and it should be read carefully. National and regional figures remain robust. Authority-level figures should be treated as one input among several, not as a definitive count of the trade in a given place.
The next move is to invest in local intelligence. This is well-trodden ground for licensing officers, but less familiar to the wider transport planning community. The Department for Transport’s Best Practice Guidance from 2023 sets out a recognised methodology for taxi unmet demand surveys, refined over many years by the Institute for Transport Studies at Leeds and used by practitioners such as the TAS Partnership and Vector Transport Consultancy. The core of the approach is the Index of Significance of Unmet Demand, an index that combines patent demand observed at ranks, suppressed demand identified through public attitude surveys and other measures into a single value. Values above 80 indicate significant unmet demand. The methodology has been applied in places as diverse as Bath and North East Somerset, Stirling, Dundee and Milton Keynes, and most respected practitioners follow some version of it.
The methodology matters because it gives planners a way to characterise the local trade that does not depend on the licensing register. Rank observation tells you how the visible part of the trade is performing. Trained interviewers asking the public about their recent experience of taxis and private hire vehicles will surface the suppressed demand that ranks alone miss. Stakeholder consultation with the trade, with disability groups and with employers like the night-time economy gives texture to the numbers. Done properly, an unmet demand survey is the most honest description you can get of how the trade is functioning, regardless of where the underlying vehicles are licensed.
A complementary move is to work with operators rather than just with councils. The trade in any given town is, in practice, organised around a small number of dispatch platforms and PHV operators. They know how many active vehicles they have on the road on a Saturday night. They know how many bookings they refuse and how many they fulfil. They know where their drivers come from and which licensing authorities have granted them their plates. Getting that information into the planning process requires building working relationships, signing data-sharing agreements where appropriate, and accepting that commercial data will sometimes have rough edges. But it is far more useful than guessing from a distorted licence register.
Practitioners who have spent time on this work tend to give similar advice on how to make it pay off. Start with a clear brief about what you actually need to know, because operator data tends to be voluminous and unfocused unless you ask specific questions. Be honest about what you will do with the information, since operators are understandably cautious about data that might end up justifying a cap on numbers or a tougher policy. Anonymise where you can, aggregate where you cannot, and treat the engagement as a long-term relationship rather than a one-off ask. The strongest evidence bases for taxi and PHV policy tend to involve several rounds of operator dialogue, repeated rank observation across different times of year, and a willingness to revisit the methodology when new dispatch patterns emerge. None of that is exotic. It is the same patient, locally rooted approach that distinguishes the best transport planning in any mode.
There is also a substantial amount of useful intelligence sitting in cross-border enforcement work itself. Joint operations of the kind Wolverhampton conducts with Cheshire East, with Cheltenham and with Greater Manchester licensing officers produce structured information about which vehicles are turning up where, and how they are behaving when they get there. Where local authorities can coordinate compliance with each other, they end up with a much better picture of the trade than either could produce alone. The Institute of Licensing has been active in promoting this kind of joint working, and several regional groupings have begun to formalise it.
At the national level the policy direction is finally moving. In November 2025 the government added a clause to the English Devolution and Community Empowerment Bill that gives the Secretary of State for Transport powers to introduce national minimum standards for taxi and PHV licensing. In January 2026 the Department for Transport launched a consultation on transferring licensing responsibility from the existing 263 lower-tier authorities to around 70 local transport authorities, with the explicit aim of reducing the number of permissive outliers and tightening the safeguarding regime. Whether or not the cross-border framework itself is changed, the combination of national minimum standards and fewer licensing bodies will narrow the gap between the most and least demanding authorities. Some of the practical incentive to shop around for the cheapest licence should weaken.
None of that will eliminate the underlying problem for planners. Even with seventy authorities instead of two-hundred-and-sixty-three, the geographic disconnection between licence and operation will persist. App-based platforms will continue to dispatch work nationally. The taxi and PHV trade will continue to behave as a mostly national market with strong local accents, rather than as a collection of self-contained local markets. The planner’s job will continue to involve triangulating across multiple imperfect data sources rather than reading the answer off a single table.
The constructive way to think about all this is that the Wolverhampton effect is a useful reminder of something we should already have known. Taxi and PHV statistics are administrative data, produced as a by-product of regulation, and they reflect the structure of the regulatory system rather than the structure of the trade itself. Whenever the regulatory system has an unusual feature, the data will inherit that feature. In the current system, the unusual feature is that one council out of 263 holds the licences for a very large slice of the national trade. That is a fascinating fact about regulation. It is a much less useful fact about transport.
If we want better data about transport, we have to go and collect it. Unmet demand surveys are an established route. Operator engagement is another. Cross-border enforcement intelligence is a third. None of them is glamorous. All of them are within reach of any reasonably resourced local authority or transport body that decides taxis and PHVs are worth taking seriously. The Wolverhampton numbers are, in a strange way, a gift. They make the case for local intelligence so vividly that nobody who has looked at them can keep treating the official licence register as the whole story.
👩🎓 Latest Research
The clever clogs at our universities, government departments, and other clever people have published the following excellent research. Where you are unable to access the research, email the author – they may give you a copy of the research paper for free.
A fuzzy logic model for taxi service assessment using passenger survey data from Ukraine and Poland
TL:DR - Builds a Mamdani fuzzy inference system that maps three passenger psycho-emotional factors (Trust, Empathy, and Control) into a star rating for taxi trips. A useful reminder that service quality is more than waiting time and fare, and that operators wanting to lift ratings should be paying attention to how drivers make passengers feel.
The air quality effects of Uber
TL:DR - Uses staggered difference-in-difference estimators on EPA air quality data to identify the causal effect of Uber’s arrival on US urban air quality. Finds that Uber improves it, with most of the gain coming from falling summer ozone. Counterintuitive given the deadheading and induced-demand literature, and an important reference point for anyone arguing about whether ride-hailing helps or hurts urban sustainability.
TL:DR - Looks at how electric ride-hailing drivers actually decide when and where to charge when they cannot predict their next fare. Identifies distinct preference clusters, which matters for charging infrastructure planning because designing for an average driver leaves a lot of the fleet badly served.
TL:DR - Surveys 432 ride-hailing drivers in Zhangzhou and compares EV acceptance between full-time and part-time drivers. The split matters because most electrification policy treats ride-hailing drivers as a uniform group, when in fact part-timers face very different economics around charging downtime and depreciation.
TL:DR - A mixed-methods look at how transport barriers for disabled travellers are built up from vehicle design, infrastructure and driver behaviour together. Includes specific findings on rickshaw and ride-hailing reluctance to carry wheelchair users, and the so-called disability tax that passengers end up paying.
😀 Positive News
Some good things have happened in the taxi and private hire world recently. It’s not all about Wolverhampton.
Hackney rolls out 50+ rapid EV chargers, with taxis in mind
Hackney Council switched on the first nine of a planned 50-plus 100kW rapid chargers in March, delivered with ESB Energy and running on 100% renewable electricity. The bays are designed for larger vehicles including taxis and PHVs, with extra space and easier access for drivers with accessibility needs. A discounted overnight rapid rate for residents with EV parking permits is included, which is the kind of detail that makes the difference between a driver who can switch to electric and one who cannot.
LEVC delivers electric TX black cabs to Gibraltar
LEVC handed over 11 new zero-exhaust-emission-capable TX taxis to the Gibraltar Ministry of Transport in late March. It is the first time the iconic London black cab has been deployed in the territory, and because the TX is wheelchair accessible by design it lifts the accessibility floor for the local taxi fleet at the same time as it cuts emissions. Over 12,000 TX taxis are now on the road globally, with a claimed 360 million kilograms of CO2 avoided to date.
FREE NOW by Lyft offers a £500 bonus to bring more women into London’s black cab trade
To mark International Women’s Day, FREE NOW by Lyft put a £500 sign-on bonus and six commission-free weeks on the table for any female black cab driver registering with the platform by 31 March 2026. Women still account for under 3% of London’s licensed taxi drivers, so the headline figure matters less than what sits behind it, which includes accident and sickness insurance, parental and compassionate leave, and EV charging discounts through OVO and bp pulse. A small step in a sector that has been overwhelmingly male for a very long time.
Ireland renews its electric taxi grant scheme for 2026
The 2026 Electric Small Public Service Vehicle (eSPSV) Grant Scheme is open again, with €7 million on the table to help Irish taxi and ride-hailing drivers switch to electric. Drivers can get up to €25,000 for a wheelchair-accessible EV or €17,500 for a battery EV when scrapping a high-polluting older vehicle. Since 2018 the programme has put €65 million towards 3,600 vehicles, and while this year’s budget is smaller than last year’s it still keeps the pipeline open at a moment when several other countries have let theirs lapse.
Bolt publishes a 2026 women’s safety roadmap with onboard dashcams and self-defence workshops
Bolt set out a structured 2026 plan to improve safety for women on its rideshare platform, built around four pillars including the Women for Women service, training, deterrent technology and user empowerment. The most interesting practical bits are free monthly self-defence workshops open to female passengers and drivers, and a smartphone-as-dashcam solution that records the road and the cabin without forcing drivers to invest in hardware. The roadmap will be reviewed every six months, which is the kind of governance discipline these initiatives often lack.
💻 Hard Work
Mobility Camp and the Transport Box project have been going good guns for the last week. For the former, we have been organising some outside sessions (as these things need booking WAY in advance). For the latter, we have been recruiting engineers to be part of the project.
🎶 Musical Finale
Thrash metal. A spectacular light show. Smashing equipment. Sychronised head-banging. It can only be a Slipknot song. This is the best song, off their best album since Iowa. If you love heavy metal, you will love it. If you don’t, you won’t. Its that simple.